 O P N LIO
Complete Explanation Guide
O P N LIO — O P N LIO System, Empire of the Wealthy, Smart Pivot, King's Call
This guide explains every visual element you see across the four scripts: every color, every number, every line, every alert — and what it means. Everything on the chart has a reason, not decoration.
An adaptive line that changes speed with market momentum: green = uptrend, red = downtrend. Small circles at highs/lows mark a "liquidity footprint" with the traded volume at that exact point. The label above/below shows accumulated buy/sell volume and "Delta Volume" — a positive number means stronger buying pressure despite the visible trend.
Transparent green box = unclosed bullish gap. Red = unclosed bearish gap. Stays drawn until retested (alert fires) or fully closed.
Green/red dashed line auto-built from real swing highs/lows. A break against it fires an alert.
Gray shaded area = momentum cloud. Cyan line = Core Line (a touch is a "gate" that fires an alert). Pink = Instant Path (fastest). Blue = Momentum Pulse. Red = Balance Point. Yellow/orange = Shield (drawn as a fourth line alongside the three paths: yellow above price, orange below — the most important line here). When the four lines stack in clean ascending order, that's a clean uptrend.
Every candle is tinted by a 0-100 score: neon green = very positive (80+), dark green = positive, white = neutral, pink = negative, dark red = very negative.
A 4-timeframe table (Monthly/Weekly/Daily/4H) with a liquidity number and green/red dot. The "Speed Radar" cell gives the instant verdict: Call Allowed / Put Allowed / Please Wait. The "Power %" cell combines the timeframes with different weights — the actual signal only fires when both agree.
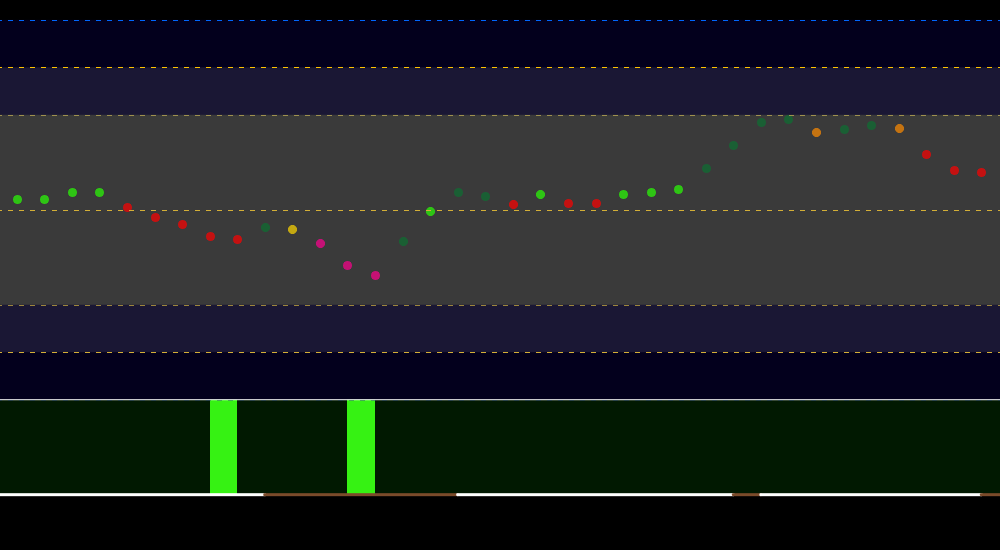
One line from a proprietary composite liquidity formula. Its color reflects liquidity state: neon green (very strong buying flow), green/yellow (healthy buying), pink (weakness), red (very strong distribution). Horizontal zones: -10/10 (sharp selling surge — this level's line itself turns brown on above-average volume), 10/30, 20/80 (normal range), 70/90, 100/120 (sharp buying surge).
The -10 level line itself (the edge of the sharp selling-surge zone) automatically switches from white to a thick dark brown when trading volume exceeds its 20-candle average as the path touches this level — an extra visual cue that the selling surge is backed by real volume, not routine movement.
Divergence: price moves one way while the momentum gauges move the other — a lower price low against a higher low on the gauges means real strength does not support the visible drop, and the mirror image near tops. An internal engine checks several tools together; when a detection coincides with entering the -10/10 or 100/120 zone, that zone glows neon and detection bars appear. Hover the small circle to see how many gauges agree.
A moving circular line reading the "shape" of momentum. Colors: neon green = very strong bullish, dark green = strong bullish/bullish slowdown, bright red = very strong bearish, pink = strong bearish/bearish slowdown, orange = reversal from top, gold = reversal from bottom, white = neutral.
Green background (call rally): a gold reversal candle within the 48-52 range, preceded directly by a strong bearish candle, with a bullish momentum average confirming. Red background (put rally): the mirrored logic.
Shows classification (color only) and value for three timeframes together: current, weekly, daily — the larger timeframe supports or rejects what's happening on the smaller one.
Green = pivot above price (resistance). Red = pivot below price (support). Gray with a crown = central pivot point (always fixed). Blue/yellow = dynamic support/resistance zones.
The first number = strength ranking (1 = strongest). The second = actual price. Each star = another independently-computed level converging there — more stars means greater importance.
One sentence: Strong Buy / Buy / Wait / Sell / Strong Sell — built on a 5-metric vote filtered by the weekly timeframe. Enter only at the first moment the verdict changes.
A light background = weekly approval. The "Entry Call/Put" label appears only after a complete 4-step sequence ending in a confirmed breakout on above-average volume.
A burst box: when 5+ reversal candles repeat within the last 10, a golden box is drawn over the squeeze zone’s high and low (preceded by a 3/5… 4/5 charge counter). No direction is guessed — a close outside the box fires a neutral golden circle ●: a burst confirmed by the break. It also audits itself: the share of the last 20 bursts followed by a real move is shown in the circle’s tooltip.
A "Wait for Speed Radar" label appears after a daily signal and confirmed retest — final entry permission comes from the Speed Radar in the System.
Top Secrets
Hierarchy matters more than tool count
Weekly Shield first ← Volume Wave Cloud ← Advanced Cloud & Trendlines ← Candle Coloring ← Liquidity & Power Radar last as final permission.
Timeframe conflict is the biggest warning
If the weekly Shield gives a buy but the daily radar is very weak, wait for the daily to improve before entering.
Enter only at the first change
The most common mistake: entering after a signal repeats for several candles instead of its very first appearance.
Agreement between independently-built tools is the strongest proof
When O P N LIO System, Empire of the Wealthy, Smart Pivot, and King's Call all agree at the same moment — each built on entirely different internal logic — that's the strongest possible confirmation of decision quality.
King's Call is the last line of defense, not a starting point
Go through the other three first, then ask King's Call: do you still agree?
Secrets Behind Each Script
O P N LIO System
The Advanced Cloud "gate" touch is not an entry signal — it's an alert to a decision zone; act only on the following candle. Negative Volume Delta reveals a weakening trend even while the cloud stays green. A gap retested within minutes isn't a real retest — that's why at least a full day's wait is required.
Empire of the Wealthy
Repeated Enforcer reversal candles don't signal direction — they signal accumulating tension that releases more violently the longer it builds. The breakout candle itself must be clearly classified (strong or very strong) — a reversal candle at the breakout point doesn't count as a real break.
Smart Pivot
Stars are a real confidence measure: each star means another independently-computed level converging at the same spot. The central pivot (crown) always stays the highest authority, even with a low rank number, because it's the mathematical foundation for everything else.
King's Call
Double Shield is slower and safer; Voice of Darkness is faster and riskier — never rely on it alone. King's Call and Voice of Darkness agreeing at the exact same moment is the strongest possible confluence inside this script, since they rely on completely different logic (instant vote vs. cumulative history).
Combination Secrets Across the Four Scripts
The full hierarchy
O P N LIO System (trend + moment quality) ← Empire of the Wealthy (hidden liquidity + momentum) ← Smart Pivot (level map) ← King's Call (final verdict). Each layer filters out weak opportunities before the next.
Smart Pivot as a permanent final filter
No matter which script gave the signal, always check last: are you close to a strong opposing pivot level? If so, wait for an actual breakout first.
No allowed conflict between the Shield and King's Call
If the weekly Shield in O P N LIO System gives a sell while King's Call says buy, that's a serious structural conflict — don't enter until both agree.
Speed Radar is a shared checkpoint
Both War Cry in King's Call and the Voice of Darkness signals require waiting for Speed Radar permission in the O P N LIO System before any actual entry.
Alert Breakdown Per Script
O P N LIO System (in order)
1) Bullish/Bearish Shift - Volume Wave Cloud. 2) Gap Retest. 3) Bullish/Bearish Break - Trendlines. 4) Buy/Sell Rally - Shield. 5) Gate Touch Up/Down - Advanced Cloud. 6) Very Positive/Negative Zone - Candle Coloring. 7) Rocket/Bomb - Liquidity & Power Radar (requires Speed Radar and total power to agree).
Empire of the Wealthy (in order)
1) Sell/Buy Signal - Liquidity Path. 2) Possible reversal candle within call/put range. 3) Call/Put Rally - The Enforcer (the most important, requires a full sequence). 4) Nine separate classification alerts for each candle type (very strong bullish, strong bearish, reversal, etc.).
Smart Pivot (in order)
1) Weekly Central Pivot Touch. 2) Monthly Central Pivot Touch.
King's Call (in order)
1) Buy/Sell - King's Call (only on change). 2) CALL/PUT Double Shield (after a 4-step sequence). 3) Call/Put Voice of Darkness (confirmed repeated reversals). 4) CALL/PUT War Cry (daily signal + confirmed retest).