🎓 Academy — the Indicator System track is completely free: six levels explaining every tool. Start now →
↑Real signals from the chart
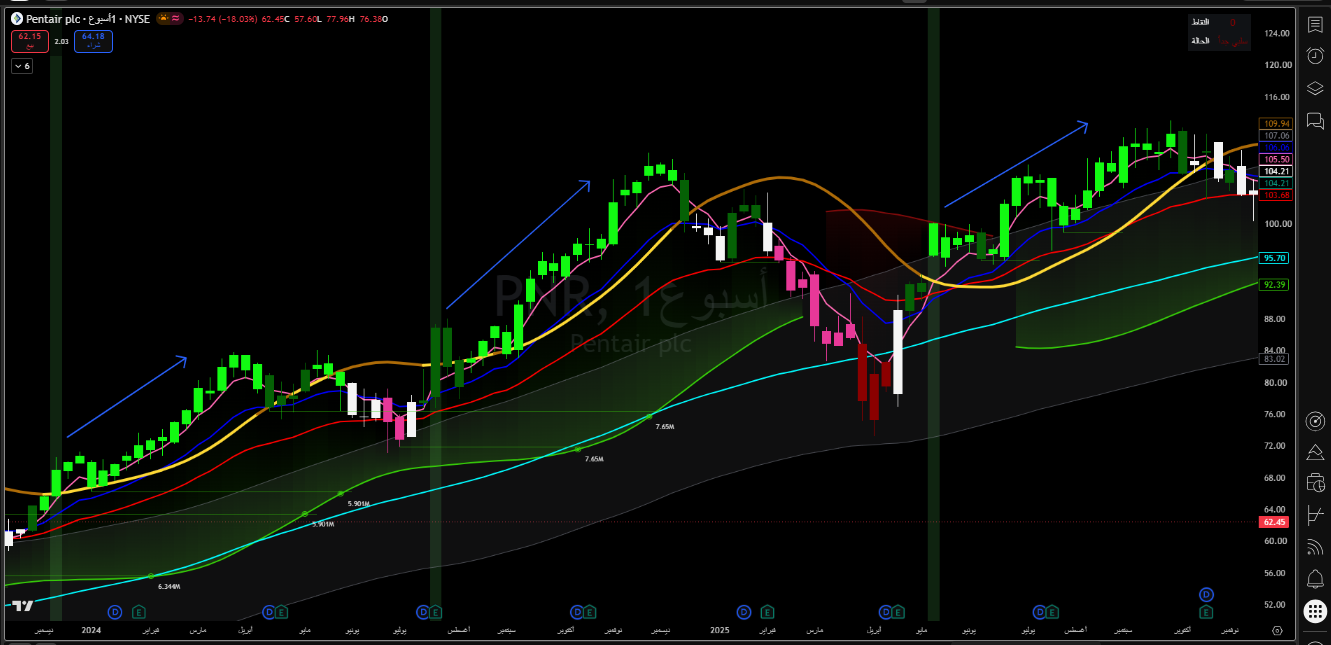
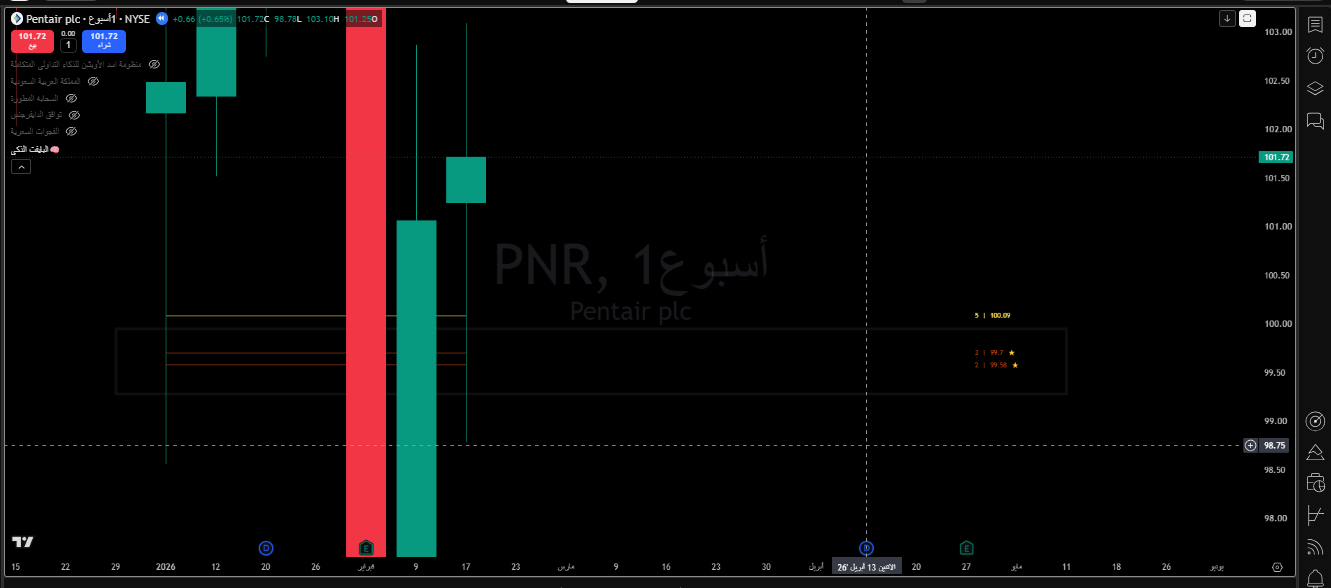
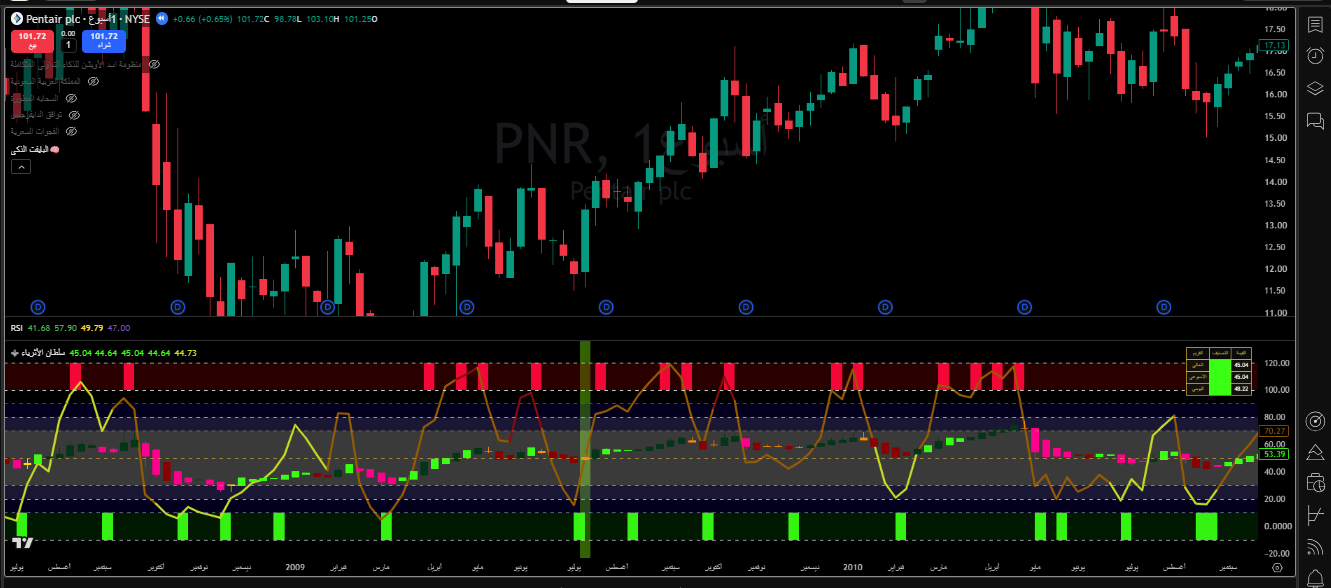
Reversal + liquidity surge before a price gap
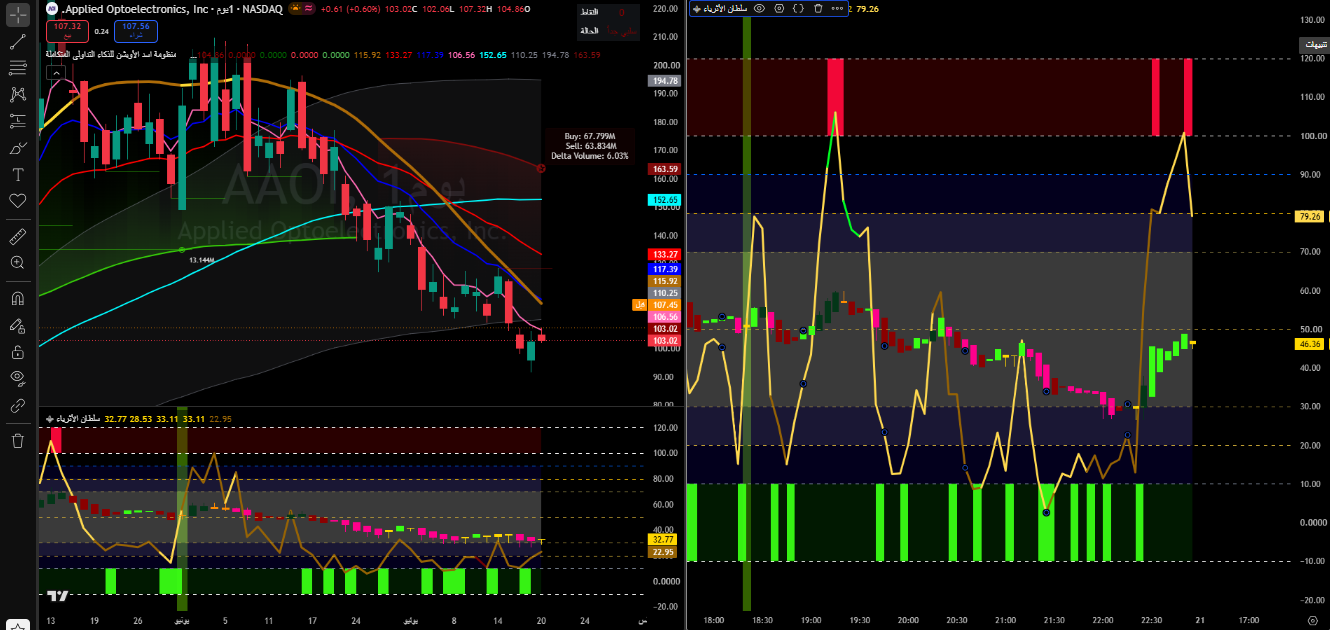
A positive reversal candle appeared on both the Daily and 5-minute timeframes in Empire of the Wealthy, synced with a clear liquidity surge on the 5-minute liquidity path — right at the end of the trading day, which preceded an upward price gap in the next session.
Shield break + negative reversal + divergence
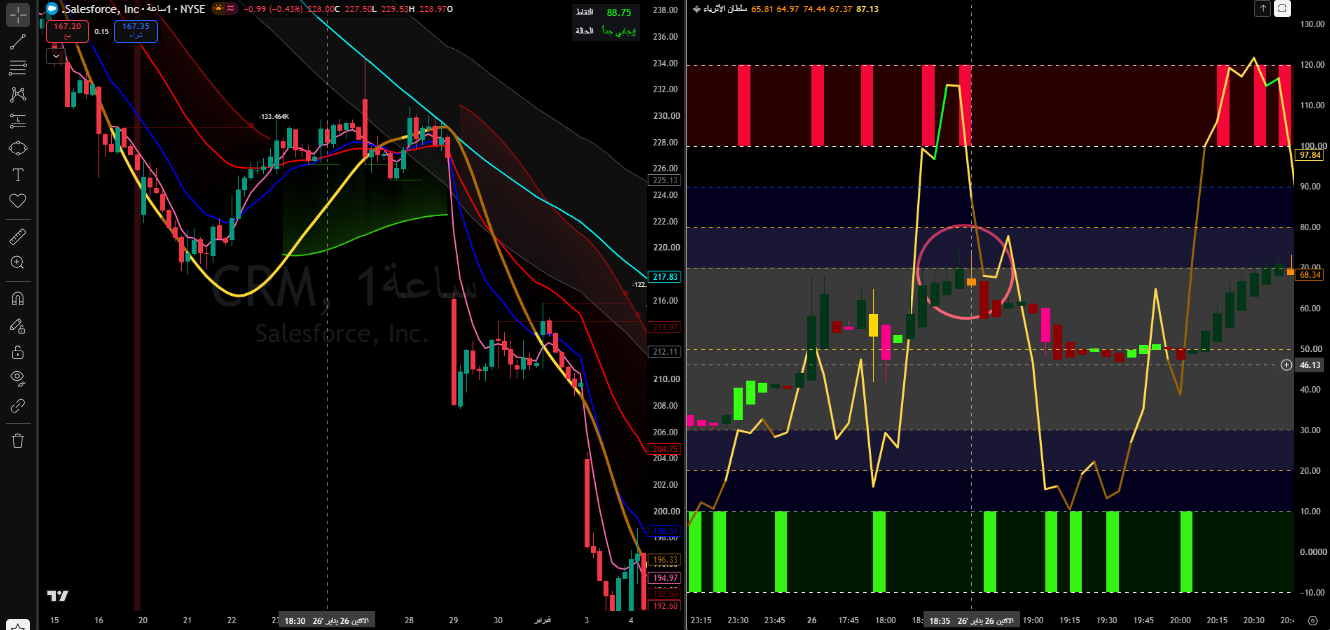
A red rally on the hourly timeframe indicated a potential decline (educational reading). Waiting for the Shield to be breached then broken, entry came at a negative orange reversal candle on the 5-minute timeframe — synced with the hidden liquidity path entering a surge zone and a negative divergence appearing, confirming the continued decline.
Monthly negative reversal, then confirmed on the daily after a failed attempt
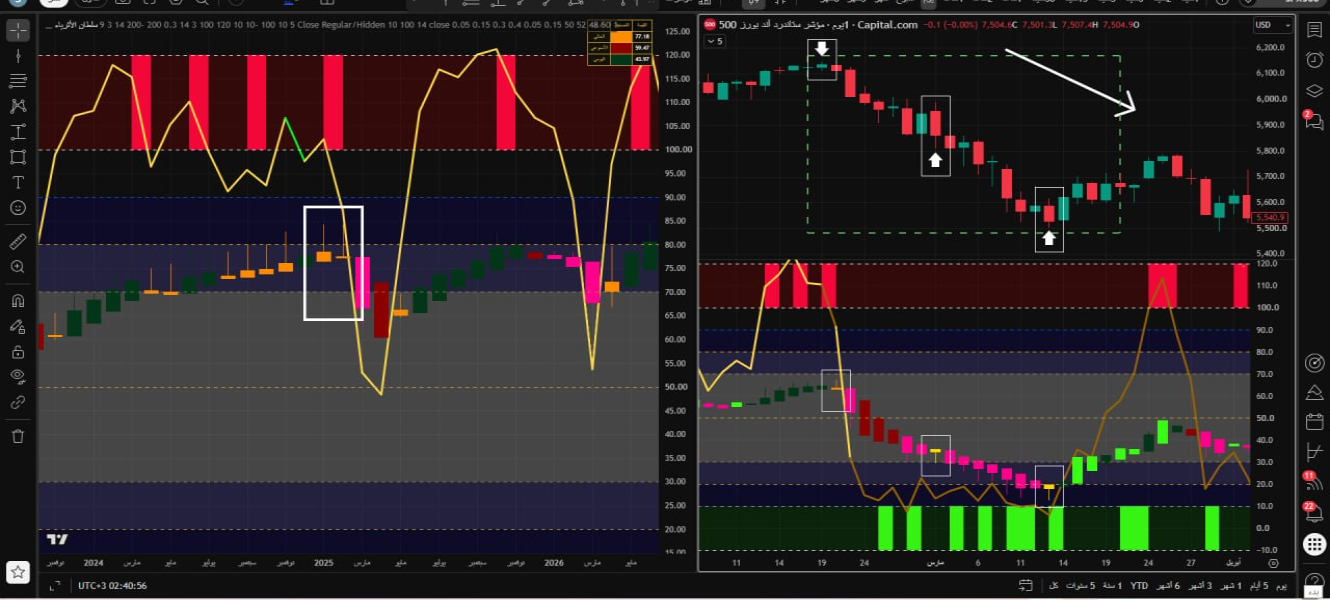
On the monthly timeframe a negative reversal candle appeared synced with a buying-side liquidity surge and a negative divergence — and the daily timeframe echoed the same negative reversal, an early warning of a downward move. On the daily chart a first positive reversal appeared but price kept declining the next day (a failed early attempt), then a second positive reversal appeared and was actually confirmed the following day — illustrating the importance of waiting for confirmation rather than rushing the first signal.